Nepal’s trekking and mountaineering sector delivered a mixed but noteworthy performance in 2025. While overall trekking numbers declined slightly compared to the previous year, several destinations recorded exceptional growth. Manaslu achieved its strongest year on record, expedition activity expanded significantly, and foreign visitor numbers to Nepal’s protected areas continued to rise, led by a major increase in the Annapurna Conservation Area.
What This Nepal Trekking Statistics 2025 article features:
- Total trekkers in 2025: 165,056, representing a 6% decline from 175,575 trekkers in 2024
- Restricted area trekking permits issued to 27,531 trekkers across 13 designated permit zones
- Manaslu’s record-breaking year with 14,720 trekkers, up 14.91% compared to 2024
- Upper Mustang’s decline to 4,178 trekkers, down 25.58% from the previous year
- Foreign visitor numbers across Nepal’s national parks and conservation areas reaching 514,160, an increase of 10.65%
- Annapurna Conservation Area becoming Nepal’s busiest protected area with 313,549 foreign visitors, up more than 30%
- Mountaineering activity expanding to 334 expedition teams and 2,766 expedition members across 78 peaks
- Everest remaining Nepal’s most popular expedition mountain with 472 climbers from 49 expedition teams
- The most climbed NMA trekking peaks in 2025, led by Mera Peak (2,633 climbers), Island Peak (2,078), and Lobuje East (1,775)
- Key trends shaping Nepal’s trekking, protected area tourism, and mountaineering sectors during 2025
All statistics presented in this article are sourced from the Nepal Tourism Statistics 2025 report published by the Ministry of Culture, Tourism & Civil Aviation. For a broader overview of visitor arrivals, tourism revenue, source markets, and industry performance, see the Nepal Tourism Data 2025 overview.
Nepal’s trekking sector in 2025 does not tell a single story. The headline number, 165,056 trekkers listing trekking and mountaineering as their purpose of visit, dropped 6% from 2024. But inside that number, some routes had their best years yet while others saw significant pullbacks!
Manaslu grew by nearly 15%, drawing 14,720 restricted area trekkers. Upper Mustang lost more than a quarter of its visitors. The Annapurna Conservation Area reached 313,549 foreign visitors, a 30% jump in a single year.
And on the expedition side, 334 teams from 52 countries attempted 78 peaks across the country.
I went through the full trekking and expedition section of the 2025 official statistics report. Here is the complete breakdown by route, region, and national park.
Total Trekkers in Nepal 2025
The Nepal Tourism Statistics 2025 report tracks trekker numbers through two main systems: purpose of visit data from immigration records, and restricted area permit data from the Department of Immigration.
By purpose of visit, 165,056 tourists listed trekking and mountaineering as their primary reason for coming to Nepal in 2025. That is a 6% decrease from 175,575 in 2024.
This is the broadest measure of adventure tourism in Nepal, and the dip is worth noting in context. Trekking as a declared purpose of visit was 14.2% of total arrivals in 2025, slightly down from 15.3% in 2024. So while total arrivals in Nepal grew by 1.29%, the trekking-specific segment contracted.
Some of this may reflect a labeling shift: tourists who trek as part of a broader holiday may simply declare “holiday” as their purpose. The 6% decline in declared trekking visitors does not mean fewer people walked the trails.
Restricted Area Trekking: The Full Route-by-Route Breakdown
Nepal’s restricted trekking areas require a special Restricted Area Permit (RAP) issued through a registered trekking agency. In 2025, 27,531 trekkers visited Nepal’s restricted zones. That is down slightly from 28,894 in 2024 (-4.73%).
Here is the complete breakdown for every permitted restricted area in 2025:
| Trekking Route | 2025 Trekkers | 2024 Trekkers | Change |
|---|---|---|---|
| Manaslu (Gorkha) | 14,720 | 12,810 | +14.91% |
| Upper Mustang | 4,178 | 5,614 | -25.58% |
| Gorkha Tsum Valley | 2,513 | 2,567 | -2.10% |
| Manang Nar Phu | 1,672 | 1,925 | -13.14% |
| Taplejung Kanchanjunga | 1,680 | 1,902 | -11.67% |
| Lower Dolpa | 1,092 | 1,348 | -18.99% |
| Humla | 770 | 1,045 | -26.32% |
| Dolakha | 274 | N/A | new entry |
| Sankhuwasabha All Restricted Areas | 255 | N/A | new entry |
| Upper Dolpa | 281 | 657 | -57.23% |
| Mugu | 76 | N/A | new entry |
| Bajhang | 11 | N/A | new entry |
| Darchula | 9 | N/A | new entry |
| Total | 27,531 | 28,894 | -4.73% |
Manaslu accounted for 53.5% of all restricted area trekking in Nepal on its own. Nothing else came close!
Looking at the seasonal pattern, October was the single busiest month across all restricted areas combined (7,743 trekkers), followed by April (4,724), November (4,225), and March (2,825). The monsoon months of June, July, and August were quiet almost everywhere.
Manaslu: Nepal’s Most Popular Restricted Trek Is Getting More Popular
Manaslu recorded 14,720 trekkers in 2025, up 14.91% from 12,810 in 2024. It is by far the most visited restricted trekking area in Nepal and has been growing consistently since the post-pandemic recovery.
For context: in 2019, Manaslu had 8,670 trekkers. In 2022, it bounced back to 5,890. By 2024 it was at 12,810, and now in 2025 it has reached 14,720. The route has more than doubled its traffic compared to pre-pandemic numbers in just a few years.
The October peak is especially pronounced for Manaslu, with 4,336 trekkers in that month alone. April (2,790) and March (1,733) are the other busy periods, consistent with spring season trekking patterns.
The main draw is the combination of remote high-altitude scenery, Tibetan Buddhist culture in the Nubri and Tsum valleys, and the challenging Larkya La crossing at 5,106 m. The route is still relatively uncrowded compared to Annapurna or Everest Base Camp, which likely adds to its appeal.
Upper Mustang: A Steep Decline That Warrants Attention!
Upper Mustang received 4,178 trekkers in 2025, a 25.58% drop from 5,614 in 2024. That follows a strong recovery the previous year (5,614 was itself up sharply from 3,387 in 2022 and 1,198 in 2023).
Upper Mustang has a well-established following among trekkers drawn to its unique Tibetan Buddhist culture and the ancient walled city of Lo Manthang.
The high permit cost ($500 for 10 days, with an additional $50 per day after that) has always been a limiting factor. Whether the 2025 decline reflects that cost, access conditions, competition from other routes, or simple year-to-year variation is not clear from the data alone.
Other Restricted Areas
- Gorkha Tsum Valley drew 2,513 trekkers in 2025, nearly unchanged from 2,567 in 2024 (-2.10%). Tsum Valley is usually combined with Manaslu for a longer itinerary, which is why its numbers tend to track alongside Manaslu’s, though at a much lower volume.
- Manang Nar Phu received 1,672 trekkers, down 13.14% from 1,925. This is one of the more recently opened restricted circuits, usually approached from the Annapurna side.
- Taplejung Kanchanjunga had 1,680 trekkers, down 11.67% from 1,902. Kanchanjunga is Nepal’s most remote and least-visited of the major trekking regions. Its restricted status and significant logistical demands keep numbers low.
- Lower Dolpa dropped 18.99% to 1,092 trekkers and Upper Dolpa had a severe decline to just 281 trekkers, down 57.23% from 657 in 2024. The Dolpo region includes the Shey Phoksundo Lake area and the walk to the ancient Bon Buddhist monastery of Shey Gompa. The dramatic drop from an already small base suggests real accessibility or permit-related issues worth monitoring.
- Humla fell 26.32% to 770. These are among Nepal’s most remote trekking destinations and tend to see relatively low but volatile numbers.
- Dolakha, home to Tsho Rolpa Lake Trek (274 trekkers), Sankhuwasabha All Restricted Areas (255), Mugu (76), Bajhang (11), and Darchula (9) are smaller restricted zones that appear in the 2025 data.
National Parks and Conservation Areas: 514,160 Foreign Visitors
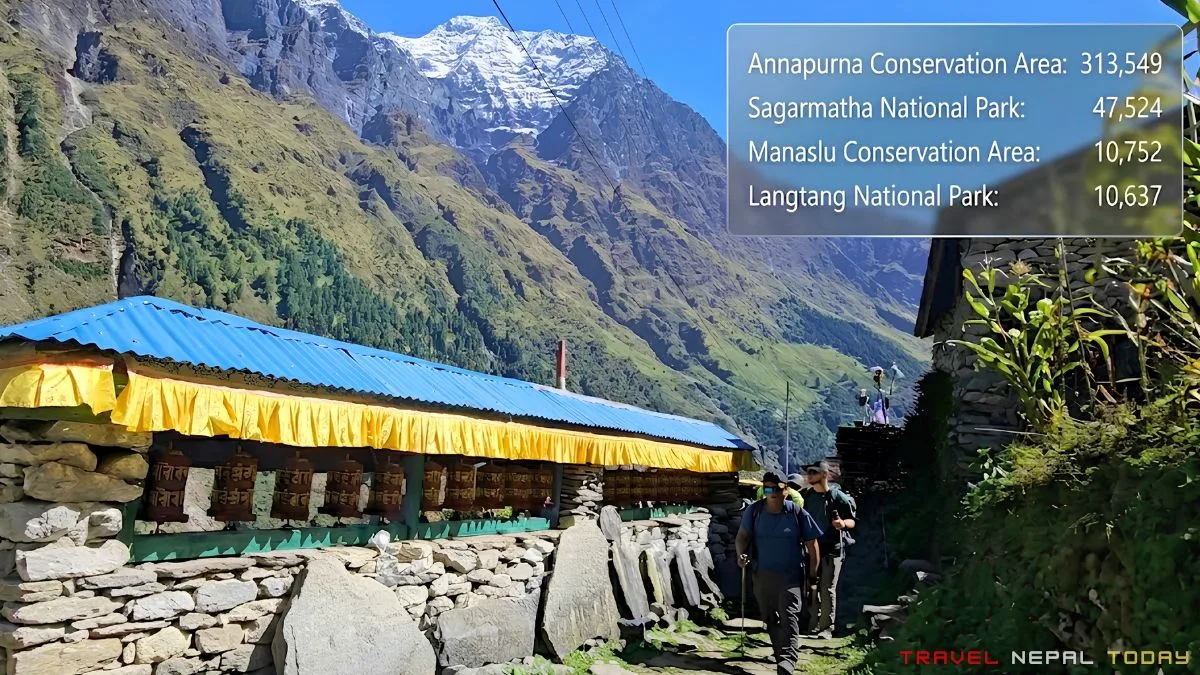
Nepal’s protected areas received 514,160 foreign visitors in 2025, a 10.65% increase from 464,653 in 2024. This is the highest total since before the pandemic!
Here is the full breakdown by protected area:
| Protected Area | 2025 Visitors | 2024 Visitors | Change |
| Annapurna Conservation Area | 313,549 | 240,141 | +30.56% |
| Chitwan National Park | 103,904 | 126,905 | -18.12% |
| Sagarmatha National Park | 47,524 | 49,372 | -3.74% |
| Shivapuri Nagarjun National Park | 11,806 | 12,679 | -6.88% |
| Manaslu Conservation Area | 10,752 | 10,082 | +6.65% |
| Langtang National Park | 10,637 | 11,180 | -4.86% |
| Bardiya National Park | 8,752 | 8,574 | +2.08% |
| Gaurishankar Conservation Area | 1,677 | 1,625 | +3.20% |
| Makalu Barun National Park | 2,118 | 1,111 | +90.64% |
| Kanchanjunga Conservation Area | 1,384 | 1,290 | +7.29% |
| Koshi Tappu Wildlife Reserve | 354 | 335 | +5.67% |
| Shuklaphanta Wildlife Reserve | 551 | 217 | +153.9% |
| Rara National Park | 324 | 277 | +16.97% |
| Dhorpatan Hunting Reserve | 226 | 119 | +89.92% |
| Shey Phoksundo National Park | 304 | 496 | -38.71% |
| Krishnasar Conservation Area | 110 | 68 | +61.76% |
| Parsa Wildlife Reserve | 45 | 68 | -33.82% |
| Banke National Park | 83 | 38 | +118.4% |
| Api-Nampa Conservation Area | 18 | 23 | -21.74% |
| Grand Total | 514,160 | 464,653 | +10.65% |
A few things stand out here:
- Annapurna Conservation Area is in a category of its own. At 313,549 visitors in 2025, it accounts for 61% of all foreign protected area visits in Nepal. And its 30.56% jump from 240,141 in 2024 is remarkable. This covers the entire Annapurna region including the Annapurna Circuit, Annapurna Sanctuary, Ghorepani Poon Hill, and the Mustang approaches. More people are trekking in the Annapurna region than in all other protected areas combined.
- Chitwan National Park saw a significant decline, dropping from 126,905 to 103,904 (-18.12%). Chitwan remains Nepal’s most visited wildlife park and a major international draw for wildlife tourism, jungle safaris, and rhino watching, but 2025 was a slow year compared to 2024.
- Sagarmatha National Park, which covers the Khumbu region and Everest Base Camp, received 47,524 visitors, down 3.74% from 49,372 in 2024. The Everest region continues to draw strong numbers, though the slight decline is notable given the growth in other areas.
- Makalu Barun National Park grew 90.64% to 2,118 visitors, and Shuklaphanta Wildlife Reserve nearly tripled to 551. These are small absolute numbers but significant as indicators of emerging interest in Nepal’s less-visited protected areas.
Mountaineering Expeditions: 334 Teams, 78 Peaks, 52 Countries
The Department of Tourism issued expedition permits to 334 teams in 2025, covering 78 different peaks. The total membership reached 2,766 mountaineers (2,145 male, 621 female), up 17.05% from 2024. Team numbers grew by 12.84%.
Total royalty collected from DOT expeditions reached approximately USD 7.7 million (NPR 1.06 billion) in 2025. Combined with Nepal Mountaineering Association (NMA) peak permits, the total mountaineering royalty figure cited in the official fact sheet reached NPR 12,62,635 thousand, a 36.38% increase from 2024.
Which Peaks Did Expeditions Attempt?
Here are the most significant peaks by team count and total members:
| Peak | Altitude | Teams | Total Members | Royalty (USD) |
| Sagarmatha (Everest) | 8,848.86 m | 49 | 472 | 5,083,952 |
| Ama Dablam | 6,814 m | 51 | 603 | 537,900 |
| Manaslu | 8,163 m | 32 | 377 | 1,123,350 |
| Himlung Himal | 7,126 m | 23 | 232 | 82,725 |
| Lhotse | 8,516 m | 13 | 129 | 235,200 |
| Kanchenjunga | 8,586 m | 8 | 78 | 100,800 |
| Dhaulagiri I | 8,167 m | 8 | 52 | 82,800 |
| Makalu I | 8,463 m | 10 | 83 | 146,700 |
| Annapurna I | 8,091 m | 6 | 66 | 118,800 |
| Barun Tse | 7,129 m | 6 | 58 | 23,175 |
- Sagarmatha (Everest) generated USD 5,083,952 in royalties from 49 teams and 472 members. That is 66% of total DOT royalty revenue from just one mountain. Of the 472 members permitted, the success data shows 251 reached the summit.
- Ama Dablam had the highest team count at 51 teams and 603 total members. It is Nepal’s most popular technical expedition peak after Everest and draws strong interest from experienced alpinists looking for a serious high-altitude challenge without the scale of an 8,000-metre attempt.
- Manaslu had 32 teams and 377 members. Its success data shows 283 successful summits out of the total, one of the higher success rates among the major 8,000-metre peaks.
Countries Sending the Most Expedition Teams
| Country | Teams | Members |
| UK | 33 | 267 |
| USA | 32 | 281 |
| India | 26 | 261 |
| France | 25 | 165 |
| Nepal | 28 | 190 |
| Germany | 21 | 144 |
| China | 16 | 189 |
| Switzerland | 11 | 61 |
| Poland | 15 | 157 |
| Canada | 9 | 105 |
Expedition teams came from 52 countries in 2025. The UK and USA lead by team count.
India’s 26 teams is a notable number, reflecting growing high-altitude mountaineering interest from Indian climbers.
Nepal itself sent 28 teams (190 members), meaning Nepali mountaineers are a significant portion of expedition activity.
NMA Trekking Peaks: Mera, Island Peak, and Lobuje Lead
Beyond the major expedition peaks permitted by the Department of Tourism, the Nepal Mountaineering Association (NMA) issues permits for a separate category of trekking peaks that individuals and small groups can attempt.
In 2025, the NMA issued permits to 2,256 teams covering 7,054 total permitted members (6,903 foreigners, 151 Nepali nationals).
The top NMA peaks by climber numbers in 2025:
| Peak | Teams | Total Climbers |
| Mera Peak (6,476 m) | 741 | 2,633 |
| Island Peak / Imja Tse (6,189 m) | 739 | 2,078 |
| Lobuje East (6,119 m) | 555 | 1,775 |
| Chulu East (6,200 m) | 52 | 136 |
| Chulu West (6,419 m) | 30 | 84 |
| Kyazo Ri (6,186 m) | 22 | 54 |
| Larkya Peak (5,106 m) | 27 | 73 |
Mera Peak and Island Peak are by far the most popular trekking peaks in Nepal, drawing nearly identical team counts (741 vs 739) but more total climbers on Mera (2,633 vs 2,078). Both are typically attempted as add-ons to Everest Base Camp or Khumbu-area treks.
Lobuje East at 1,775 climbers is the third, completing a clear Khumbu-focused top three.
Larkya Peak at 5,106 m is often climbed as an extension of the Manaslu Circuit, which aligns with the growth seen in the Manaslu restricted area permit numbers.
What the 2025 Trekking Data Is Telling You
A few observations when you look at everything together.
The Annapurna region is pulling further ahead as Nepal’s dominant trekking destination. Its conservation area numbers grew 30.56% in a single year to 313,549 foreign visitors. The diversity of routes (Circuit, Sanctuary, Poon Hill, Mustang approaches) and relatively good infrastructure make it accessible to a wide range of trekkers.
Manaslu is the standout growth story in restricted area trekking. From 8,670 trekkers in 2019 to 14,720 in 2025, it has become the clear leader in the restricted zone category. The continued growth in Manaslu Conservation Area visitors (10,752, +6.65%) confirms the region is handling more traffic across the board.
Khumbu and Sagarmatha are steady but not growing. Sagarmatha National Park dropped slightly to 47,524 from 49,372. This does not mean fewer people are going to Everest Base Camp, but it does suggest the Khumbu region is not seeing the same growth as Annapurna.
Upper Dolpa is the most concerning trend: a 57.23% drop to just 281 trekkers in one of Nepal’s most remote and culturally distinct trekking areas. Routes like these need attention from a promotion and access perspective.
On the expedition side, the 36.38% jump in royalty revenue to NPR 12,62,635 thousand tells you that both the number of climbers (up 17%) and the mountains they are attempting (more higher-royalty peaks) both moved in the right direction for Nepal’s mountain revenue.