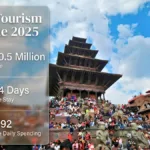
Nepal welcomed 1,162,365 international tourists in 2025. While the arrival figure itself is significant, the reasons visitors came reveal even more about how Nepal’s tourism sector is evolving. Holidays remained the dominant travel purpose, pilgrimage nearly matched trekking in visitor numbers, and a rapidly expanding “Others” category showed that Nepal is increasingly attracting visitors whose motivations extend beyond mountains and adventure tourism.
What This Nepal Tourism Purpose of Visit 2025 Article Focuses On:
- Complete 2025 purpose-of-visit breakdown for all 1,162,365 international tourist arrivals, with exact visitor figures for each category
- Year-over-year comparison showing how every visitor purpose category changed from 2024
- A 30-year historical trend analysis illustrating how visitor motivations have evolved since 1993
- Lumbini pilgrimage tourism reaching 153,692 third-country visitors in 2025, a 37.96% increase, including detailed country-by-country visitor analysis
- Pashupatinath Temple welcoming 122,431 international visitors in 2025 while recording a notable 10% decline from the previous year
- The fast-growing “Others” category, which expanded by 15.8%, and what types of travelers are contributing to this shift
- How pilgrimage tourism has quietly risen to nearly match trekking as one of Nepal’s major travel motivations
- The continued dominance of holiday and leisure travel and its share of total international arrivals
- What changing visitor motivations indicate about Nepal’s tourism diversification and long-term development prospects
- Key insights into how Nepal is increasingly attracting visitors beyond its traditional mountain tourism market
All figures presented in this article are sourced from the Nepal Tourism Statistics 2025 report published by the Ministry of Culture, Tourism & Civil Aviation. For a broader overview of visitor arrivals, tourism revenue, and industry performance, read our Nepal Tourism Data 2025 guide.
Most people outside Nepal still think of this country as a mountaineering and trekking destination. Everest, Annapurna, Manaslu. That framing made sense decades ago when adventure travelers made up the majority of arrivals. But the 2025 data tells a different story!
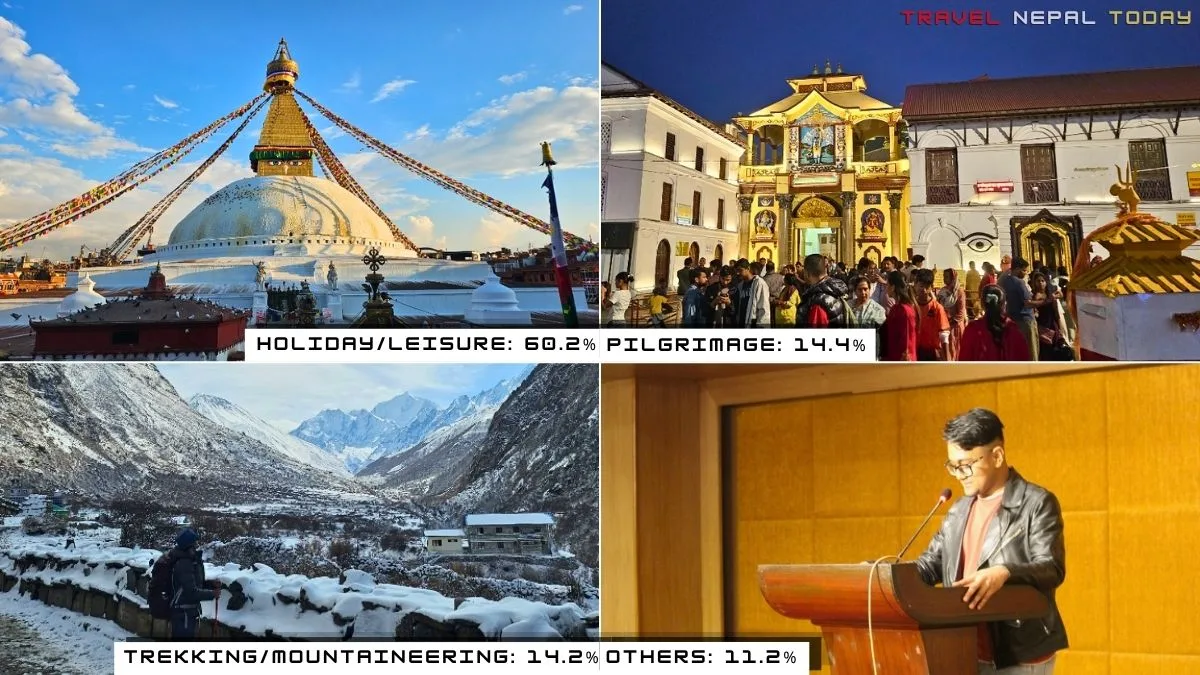
Trekking and mountaineering now account for 14.2% of tourist arrivals. Pilgrimage accounts for 14.4%. These two categories, separated by just 2,324 visitors out of 1.16 million, are essentially tied.
And the “Others” category, which covers business travel, medical tourism, and people visiting friends and relatives, grew faster than any other segment at 15.8%.
Nepal is still a mountain destination, though. But it has not been only a mountain destination for some time, and the 2025 numbers make that clearer than ever.
Purpose of Visit 2025: The Full Breakdown
In 2025, Nepal’s tourism statistics report groups arrivals into four broad categories. Here is how they split:
| Purpose of Visit | 2025 Tourists | Share | 2024 Tourists | Change |
|---|---|---|---|---|
| Holiday / Leisure | 699,744 | 60.2% | 693,119 | +1.0% |
| Pilgrimage | 167,380 | 14.4% | 166,394 | +0.6% |
| Trekking & Mountaineering | 165,056 | 14.2% | 175,575 | -6.0% |
| Others (business, VFR, medical) | 130,185 | 11.2% | 112,460 | +15.8% |
| Total | 1,162,365 | 100% | 1,147,548 | +1.29% |
Holiday tourism grew modestly, pilgrimage barely moved, trekking dipped by 6%, and Others jumped sharply. That is the 2025 picture in one line. But behind each of those numbers is a more detailed story!
Holiday and Leisure: Still the Biggest Draw by Far
699,744 tourists came to Nepal primarily for holidays and leisure in 2025. That is 60.2% of all arrivals and the largest segment by a wide margin. It grew 1% from 2024, which is modest but in the same direction as overall arrivals.
Holiday tourism covers a wide range of actual activities. It includes Kathmandu city tourism, Chitwan wildlife safaris, Pokhara lake visits, cultural sightseeing at Durbar Squares, Nagarkot sunrise trips, short day hikes, and combinations of all of these.
Essentially, if someone is not specifically listing trekking, pilgrimage, or business as their purpose, they are counted here!
The 60% share has stayed relatively consistent over the past decade:
- In 2019, holidays made up 65% of arrivals.
- In 2023, 62.5%.
The slight decline is not a sign that Nepal is losing leisure travelers, it reflects more tourists declaring specific purposes like pilgrimage or “others” as the data collection system gets more precise.
What is worth noting is that Nepal’s holiday offering extends well beyond Kathmandu. Pokhara draws travelers for lakeside relaxation and paragliding. Chitwan and Bardiya are recognized wildlife destinations with resident Bengal tigers and one-horned rhinoceroses.
And tourism to lesser-known valleys and cultural zones is gradually increasing, even if those numbers are not separately tracked in the official data!
Trekking and Mountaineering: Dominant in Identity, Declining in Share
165,056 tourists listed trekking and mountaineering as their primary purpose in 2025, a 6% decline from 175,575 in 2024. That gives trekking a 14.2% share, which is its lowest in several years!
This is the number that will get attention from anyone who follows Nepal’s adventure tourism sector, and it deserves some honest context before conclusions are drawn.
First, the 6% drop does not necessarily mean fewer people walked the trails. Someone who spends 10 days trekking the Annapurna Circuit but arrived on a general tourist visa listing “holiday” as the purpose is counted in the holiday category, not the trekking one.
It is this discrepancy that makes these statistics a bit loose.
The purpose-of-visit data captures what people declare at immigration, not everything they actually do in Nepal.
Second, looking at the longer trend is instructive. In 1993, trekking and mountaineering accounted for 23.7% of all arrivals. By 2000, it was 25.6%. It stayed in that range for much of the 2000s.
By 2019, it had settled around 16.5%. In 2025, 14.2%. So the declared trekking share has been trending down for roughly two decades, not just in 2025.
The most likely explanation is not that Nepal is losing trekkers but that Nepal is gaining more tourists across other categories. The denominator is growing.
Trekking’s absolute numbers fluctuate, but its share of the total declines as the overall arrival base becomes more diverse. That said, a 6% absolute decline in declared trekking visitors is worth watching in 2026.
Pilgrimage: The Quiet Rise That Is Now Statistically Equal to Trekking
167,380 tourists listed pilgrimage as their purpose in 2025. That is 14.4% of total arrivals and, for the first time in recent memory, it is functionally equal to trekking and mountaineering.
This has been building for a long time. In 1993, pilgrimage was 6.6% of arrivals. In 2000, it was around 3.5%. It climbed back to 14.4% in 2019 and has held steady in that range since, while trekking’s share has gradually declined.
The growth of pilgrimage tourism tracks directly with India, Bangladesh, Sri Lanka, Thailand, and Myanmar sending more visitors. These are predominantly Buddhist and Hindu-majority countries, and Nepal’s pilgrimage circuit is deeply connected to both traditions.
Lumbini in 2025: The Strongest Performance in Years
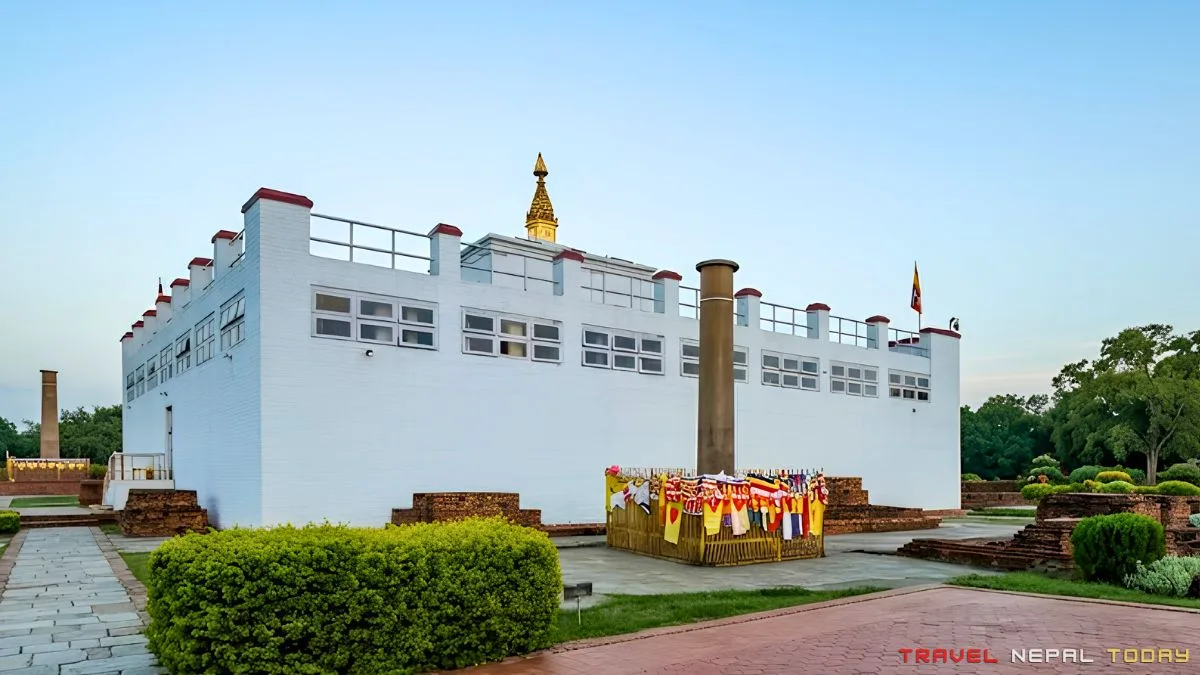
Lumbini, the birthplace of Gautama Buddha, received 1,126,419 total visitors in 2025. That includes:
- 702,910 Nepali visitors
- 269,817 Indian visitors
- 153,692 visitors from all other countries, up 37.96% from 111,403 in 2024
The 37.96% jump in third-country visitors is one of the most dramatic growth figures in the entire 2025 statistics report. And the country-level breakdown shows exactly where it is coming from:
| Country | 2025 Lumbini Visitors |
|---|---|
| Sri Lanka | 32,287 |
| Thailand | 19,891 |
| Myanmar | 18,528 |
| China | 10,789 |
| Vietnam | 8,615 |
| South Korea | 3,895 |
| Germany | 2,378 |
| Taiwan | 2,315 |
| Malaysia | 2,112 |
| Bhutan | 1,539 |
| USA | 1,525 |
| Indonesia | 1,416 |
| France | 1,367 |
| Japan | 1,260 |
| UK | 1,215 |
Sri Lanka, Thailand, and Myanmar together account for 70,706 out of 153,692 third-country visitors, which is 46% of all non-Indian international visitors to Lumbini.
The pattern is clear: Buddhist-majority countries in South and Southeast Asia are the primary driver of Lumbini’s international growth.
Seasonally, February, March, and November are the peak months for third-country Lumbini visitors, which aligns with Buddhist festival calendars and the general spring and autumn travel seasons.
Indian visitor numbers to Lumbini reached 269,817 in 2025, with March (34,963) and November (30,072) as the peak months.
The India connection to Lumbini runs deep, partly because Indian Buddhists, Hindus, and heritage travelers have historically viewed the birthplace of the Buddha as a significant cultural site regardless of religious background.
Pashupatinath: Strong Site, Softer Numbers in 2025
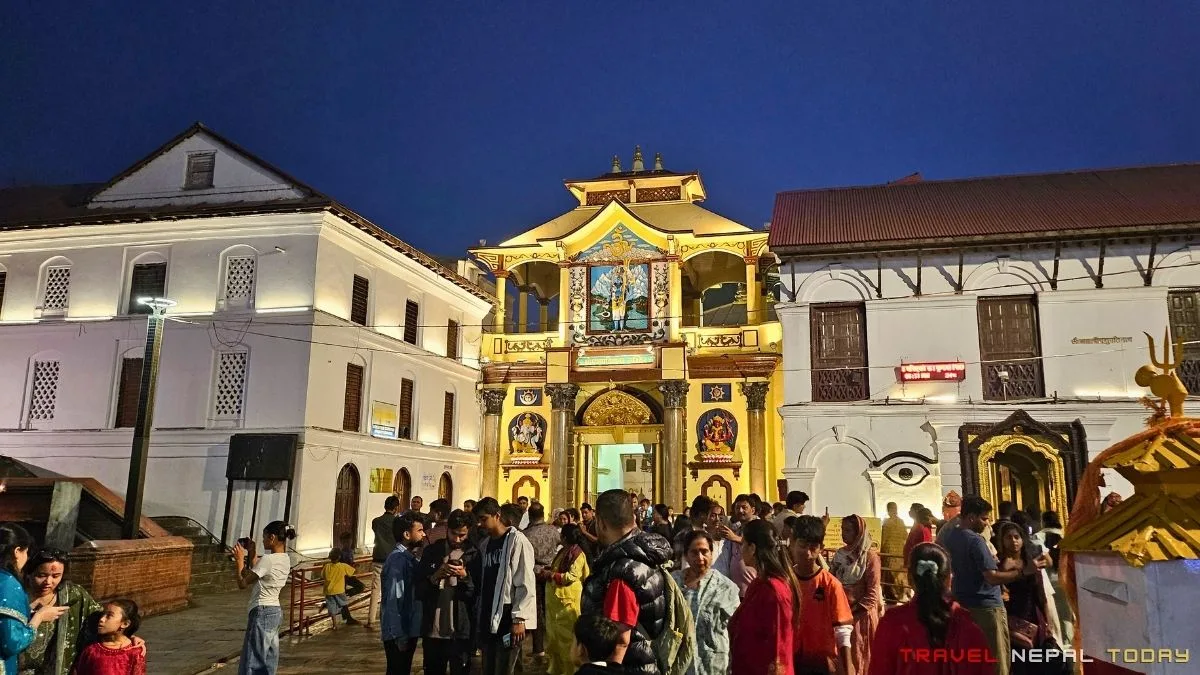
Pashupatinath Temple in Kathmandu received 122,431 international visitors in 2025, a 10.07% decline from 136,139 in 2024. This is notable because Lumbini went up sharply while Pashupatinath went down.
The temple is Nepal’s most important Hindu pilgrimage site and one of the most significant Shiva temples in the world. It draws Hindu pilgrims from across South Asia alongside travelers who come for the evening aarti ceremony on the banks of the Bagmati River.
Monthly visitor data shows October as the peak (23,739), with April (21,243) and March (16,609) also high. The drop from 2024’s October peak of 25,211 to this year’s 23,739 is modest, but November saw a significant decline from 15,054 to just 2,125. That particular month accounts for much of the overall annual shortfall.
The reasons for Pashupatinath’s 10% dip are not explained by the data itself. Visitor patterns at pilgrimage sites can shift based on the religious calendar, major festivals, regional events, and travel trends in the primary source countries.
India is by far the largest group of Pashupatinath visitors, and the slight dip in overall Indian arrivals to Nepal in 2025 likely contributed.
You might want to check out: Top nationalities that visited Nepal in 2025
The “Others” Category: Nepal’s Fastest-Growing Visitor Segment
130,185 tourists came to Nepal in 2025 for purposes outside the three main categories. That is 11.2% of all arrivals and a 15.8% increase from 112,460 in 2024. No other category grew faster!
The official report groups these as business travel, medical travel, conferences and conventions, official visits, and visiting friends and relatives (VFR). The data does not separately break down each sub-segment, so precise proportions within this group are not available from this report.
But the 15.8% growth rate is telling something real. It reflects a Nepal that more people travel to for reasons beyond sightseeing and adventure.
- A growing Nepali diaspora abroad means more VFR travel.
- Medical tourism, particularly from India and neighboring countries, has grown as Kathmandu’s private hospital infrastructure has improved.
- Business travel and conference-based arrivals signal Nepal’s gradual integration into regional professional networks.
This is the category worth watching most closely over the next few years. If business, medical, and diaspora travel continue growing while leisure and trekking stabilize, Nepal’s tourism mix will look noticeably different by 2030 than it did in 2015!
How Tourist Motivations Have Shifted Over 30 Years
Looking at the data from 1993 to 2025 reveals how much has changed in what brings people to Nepal.
| Year | Holiday % | Trekking & Mountaineering % | Pilgrimage % | Others % |
|---|---|---|---|---|
| 1993 | 58.0% | 23.7% | 6.6% | 11.7% |
| 2000 | 55.2% | 25.6% | 6.4% | 12.8% |
| 2010 | 43.8% | 11.6% | 16.8% | 27.8% |
| 2019 | 65.0% | 16.5% | 14.4% | 4.1% |
| 2023 | 62.5% | 15.2% | 13.1% | 9.2% |
| 2024 | 60.4% | 15.3% | 14.5% | 9.8% |
| 2025 | 60.2% | 14.2% | 14.4% | 11.2% |
A few shifts are worth pointing out:
- Trekking and mountaineering’s share has halved from its mid-1990s and early 2000s peaks. It was over 25% in 2000 and sits at 14.2% today. The adventure identity Nepal carries internationally has not kept pace with the country’s actual evolving visitor mix.
- Pilgrimage has grown from a minor category at 6.6% in 1993 to roughly equal to trekking by 2025. This is a 30-year structural shift, not a temporary fluctuation. Nepal’s religious tourism sector has quietly become as large as its adventure tourism sector by this measure.
- The holiday category fluctuates the most depending on geopolitical events, disasters, and recovery cycles. The pandemic-year shifts in 2015 (earthquake), 2020 and 2021 (COVID) are visible in the longer table and explain some of the unusual percentages in those years.
What the 2025 Purpose Data Is Actually Saying
Nepal is not a one-reason destination anymore, and arguably has not been for quite some time. The 2025 data just makes it harder to ignore.
Six out of ten tourists are here for leisure and general tourism. But the remaining four in ten are split almost equally between pilgrimage, trekking, and a growing category of travelers who are here for professional, personal, or medical reasons.
Lumbini’s 37.96% jump in third-country visitors is the single most striking growth figure in the purpose-of-visit data. Sri Lanka, Thailand, and Myanmar are leading that growth. If Lumbini’s infrastructure keeps pace and international awareness grows, the pilgrimage segment has room to develop further.
Trekking’s 6% dip needs one more year of data before reading too much into it. If 2026 shows the same direction, it becomes a trend worth addressing seriously at the industry level. If it recovers, 2025 was a blip.
And the “Others” category growing at nearly 16% suggests a real economic diversification happening underneath Nepal’s headline tourism story. More business travelers, more VFR trips, more medical visits. These are not the romantic reasons people associate with Nepal, but they generate consistent, year-round arrivals that help smooth out the sharp seasonality that has always been a challenge for the sector.