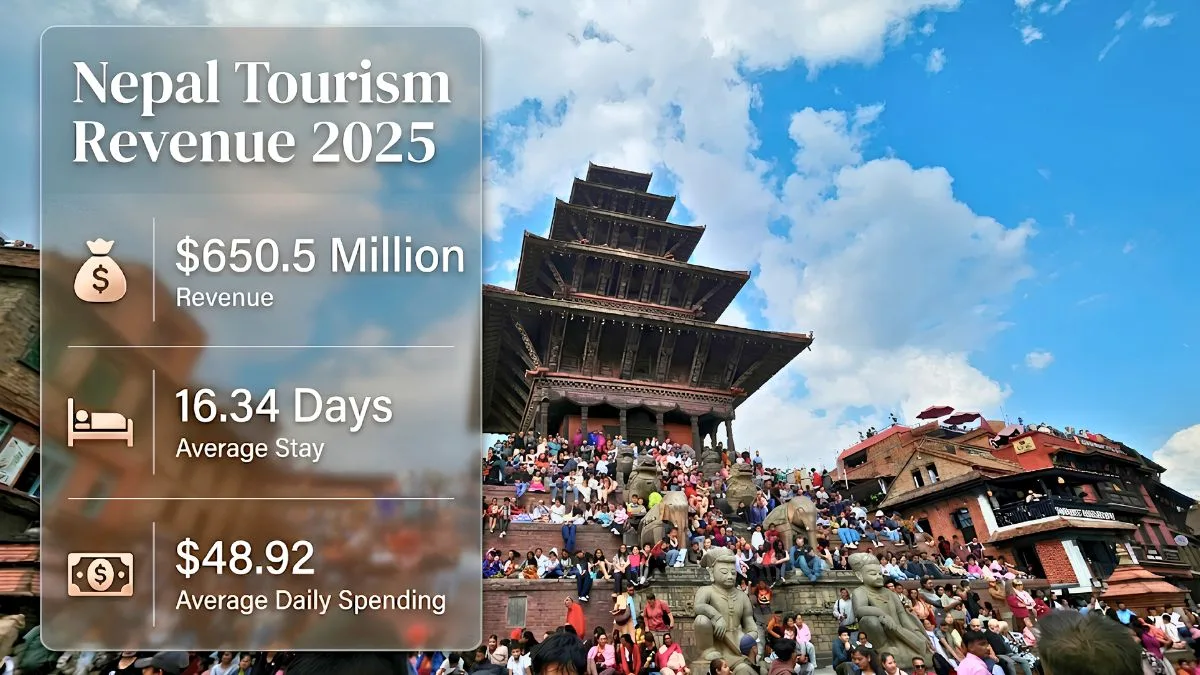
Nepal’s tourism earnings in fiscal year 2024/25 reached USD 650.5 million, bringing the country within 2.3% of its pre-pandemic record. Revenue increased for the third consecutive year. However, average daily tourist spending fell by nearly 19% in 2025, even as visitors stayed longer than at any point in Nepal’s recorded tourism history. This article examines the full picture, including tourism earnings, GDP contribution, mountaineering and casino royalties, and what changing visitor spending patterns reveal about Nepal’s tourism sector.
What This Nepal Tourism Revenue 2025 Article Focuses On:
- Total foreign exchange earnings of NPR 88,660.8 million (approximately USD 650.5 million) in FY 2024/25, a 5.1% increase in USD terms from the previous fiscal year
- Calendar year 2025 tourism earnings of NPR 87.37 billion, up 4.77% from NPR 83.39 billion in 2024
- Tourism’s contribution of 1.5% to Nepal’s GDP and 16.2% of total merchandise and service exports in FY 2024/25
- Average daily tourist spending of USD 33.09 in 2025, down 18.91% from USD 40.84 in 2024, and why overall tourism revenue continued to grow
- Average length of stay reaching 16.34 days, the highest on record, and how the CETMIS tracking system changed tourism spending measurement
- Mountaineering royalties of NPR 1,262.6 million in 2025, a 36.38% increase, with Mount Everest alone generating USD 5,083,952 from 49 expedition teams
- Casino royalties rising to NPR 450.5 million in FY 2024/25, up 35.6% from NPR 332.1 million in the previous fiscal year
- Nepal’s pre-pandemic tourism revenue peak of USD 665.6 million in FY 2018/19 and how FY 2024/25 compares
- The changing visitor mix, including Bangladesh entering Nepal’s top five source markets, and its impact on per-visitor spending patterns
- Key trends shaping Nepal’s tourism revenue performance and visitor spending behavior in 2025
All figures presented in this article are sourced from the Nepal Tourism Statistics 2025 report published by the Ministry of Culture, Tourism & Civil Aviation. For a broader overview of visitor arrivals, trekking activity, and industry performance, read our Nepal Tourism Data 2025 overview guide.
If you went by the top-line number alone, Nepal’s 2025 tourism revenue story looks straightforward. USD 650.5 million earned. Revenue up. Recovery nearly complete?
But the daily spending figure cuts the other way. The average tourist spent USD 33.09 per day in 2025, down from USD 40.84 in 2024. That is an 18.91% drop in a single year. And that number sits alongside a record-high average length of stay, a new electronic tracking system that changed how Nepal measures spending, and a meaningful shift in which countries are now sending the most tourists.
So the revenue picture is genuinely complicated. I went through the income generation, mountaineering, and tourism industry sections of the 2025 official statistics report so you can get the complete breakdown here.
Nepal Tourism Revenue in Fiscal Year 2024/25
Nepal’s official foreign exchange earnings from tourism in FY 2024/25 came to NPR 88,660.8 million, equivalent to approximately USD 650.5 million. That is a 5.1% increase in USD terms over FY 2023/24.
The report also tracks calendar year figures separately. In calendar year 2025, total tourism earnings reached NPR 87.37 billion (NPR 87 arba 37 crore 16 lakh), up 4.77% from NPR 83.39 billion in 2024. The two figures measure overlapping but slightly different periods.
Nepal’s fiscal year runs from mid-July to mid-July, so FY 2024/25 and calendar year 2025 share most of the same months but don’t align exactly. For GDP and export calculations, the FY 2024/25 figure of USD 650.5 million is the standard reference.
Tourism’s contribution to Nepal’s GDP in FY 2024/25 stood at 1.5%. The sector also accounted for 16.2% of Nepal’s total merchandise and service exports. That 16.2% figure matters!
Nepal runs a significant merchandise trade deficit, and tourism’s foreign exchange earnings are one of the primary tools for managing that gap. In that context, tourism is not a niche sector. It is the country’s largest single source of export income!
The 1.5% GDP figure, however, reflects only the direct foreign exchange earnings measurement, not tourism’s full economic footprint. When indirect effects are included, including employment across hotels, transport, food supply, and guiding, the sector’s broader contribution to GDP is substantially higher.
The World Travel & Tourism Council estimated Nepal’s tourism-related GDP contribution at approximately 6.7% in 2022.
Nepal Tourism Revenue: Year-by-Year Context
Nepal’s revenue recovery from the pandemic has been consistent since 2022. Here is the trajectory from the pre-pandemic peak:
| Fiscal Year | Revenue (USD, approx.) | Context |
|---|---|---|
| FY 2018/19 | USD 665.6 million | Pre-pandemic record |
| FY 2019/20 | Sharp decline | COVID-19 onset, March border closure |
| FY 2020/21 | Near-zero | Full-year closure |
| FY 2021/22 | Partial recovery | Limited arrivals resumed |
| FY 2022/23 | ~USD 548 million | [VERIFY: confirm from Table 7.2 in official report] |
| FY 2023/24 | ~USD 618 million | [VERIFY: confirm from Table 7.2 in official report] |
| FY 2024/25 | USD 650.5 million | 97.7% of pre-pandemic peak |
At USD 650.5 million, Nepal has recovered to 97.7% of its FY 2018/19 record. The gap is approximately USD 15 million. That is a meaningful distance to close in a single year, but not an impossible one given current growth rates.
One important caveat: The gap between 2018/19 and 2024/25 looks different in NPR terms. Because the Nepali rupee has depreciated against the US dollar since 2019, the USD-denominated figures understate how much Nepal’s NPR earnings have grown. In NPR terms, FY 2024/25 earnings have likely already surpassed the pre-pandemic peak.
How Much Do Tourists Spend Per Day in Nepal?
In 2025, the average international tourist spent USD 33.09 per day in Nepal. That is a drop of 18.91% from USD 40.84 in 2024.
At the same time, the average length of stay increased to 16.34 days, up from 13.3 days in 2024 and the highest figure Nepal has ever recorded.
Multiplying the two numbers gives a rough estimate of total per-visit spending: approximately USD 540 per visitor in 2025.
For comparison, the same calculation for 2024 gives approximately USD 543 (USD 40.84 × 13.3 days). So in per-visitor terms, total spend was almost unchanged even as the daily figure fell sharply. The longer stays compensated.
However, that compensation at the macro level does not mean all businesses experienced it equally. A tourist spending USD 33 per day over 16 days concentrates their budget in affordable accommodation, basic food, and longer budget itineraries.
A tourist spending USD 41 per day over 13 days may spend more per transaction at restaurants, on guides, and on tourism services. The distribution of spending matters as much as the total.
What CETMIS Changed About How Nepal Measures Tourist Spending
The 2025 statistics report is the first to draw its daily spending and length-of-stay data from CETMIS, the new Centralized Electronic Tourism Management Information System. Previously, Nepal estimated these figures from sample surveys and extrapolated patterns.
CETMIS tracks actual departures electronically, giving the government a more direct read on how long tourists stay.
The report acknowledges that the methodology change affects comparability. The jump from 13.3 days to 16.34 days average stay is substantial enough that some of it reflects genuine change, but part of it likely reflects CETMIS capturing a more accurate baseline than the old survey estimates did.
The same logic applies to the daily spend drop. CETMIS may produce lower daily spending figures than the older estimation method, not because tourists are actually spending less, but because the new system measures differently.
The 18.91% decline should therefore be read as a combination of real behavioral change and methodological shift, not a straightforward 19% fall in how much tourists actually spend.
Why Daily Spending Fell While Total Revenue Grew?
This is the part of the data worth thinking about carefully. Nepal earned more from tourism in 2024/25 than in 2023/24. But the average tourist spent less per day. Both can be true, and here is why:
- First, more tourists stayed longer. Nepal’s arrivals grew 1.29% to 1,162,365, and the average stay increased by 22.9%. More visitor-days in the country means more total spending even if per-day rates are lower.
- Second, the traveler mix shifted in a meaningful direction. Bangladesh entered Nepal’s top 5 source countries for the first time in 2025, replacing Australia. Bangladesh visitors generally travel on more constrained budgets than the Australian market they displaced.
Similarly, the “Others” category (business travel, visiting friends and relatives, medical travel) grew 15.8%, and those traveler categories tend to generate less daily discretionary tourism spending than dedicated holiday travelers. - Third, trekkers and mountaineers, who are typically among Nepal’s higher-spending visitor segments, actually declined as a stated purpose category. Trekking and mountaineering as a declared purpose dropped 6% in 2025 to 165,056 visitors. Read more on our Trekking Statistics 2025 article here.
- And fourth, the CETMIS methodology change almost certainly contributed to some portion of the apparent drop.
Together, these factors explain why the headline spending decline does not translate directly into a declining revenue story. But they do raise the right question for Nepal’s tourism planners: is the sector adding more visitors of the right value, or simply adding volume?
Mountaineering Royalties: Nepal’s Peak Revenue Stream
Nepal’s mountaineering royalties saw strong growth in 2025. Total royalty income from expeditions reached NPR 1,262.6 million (NPR 1 arba 26 crore 26 lakh), a 36.38% increase from NPR 925.8 million in 2024.
This covers royalties from both the Department of Tourism (DOT) for major expedition peaks and the Nepal Mountaineering Association (NMA) for trekking peaks.
Department of Tourism Expedition Royalties
The DOT permitted 334 expedition teams across 78 peaks in 2025, collecting approximately USD 7.7 million in royalties. Total membership reached 2,766 climbers, up 17.05% from 2024.
Everest dominated the royalty table, as it always does:
| Peak | Teams | Total Members | Royalty (USD) |
| Sagarmatha (Everest, 8,848.86 m) | 49 | 472 | 5,083,952 |
| Manaslu (8,163 m) | 32 | 377 | 1,123,350 |
| Ama Dablam (6,814 m) | 51 | 603 | 537,900 |
| Lhotse (8,516 m) | 13 | 129 | 235,200 |
| Makalu (8,463 m) | 10 | 83 | 146,700 |
| Kanchenjunga (8,586 m) | 8 | 78 | 100,800 |
| Annapurna I (8,091 m) | 6 | 66 | 118,800 |
Everest alone generated USD 5,083,952, which is roughly 66% of total DOT expedition royalty from a single peak. This reflects Nepal’s permit fee structure, which runs from USD 11,000 per person for teams of 1 to 7, stepping down as team size grows. With 49 teams and 472 members permitted in 2025, the per-team averages are substantial.
Ama Dablam had the highest team count at 51, with 603 members. It generates considerably lower per-team royalty than the 8,000-metre peaks, but its popularity means it contributes meaningfully to total expedition revenue.
NMA Trekking Peak Royalties
The Nepal Mountaineering Association issued permits to 2,256 teams covering 7,054 climbers across its permitted trekking peak category. The three most-climbed NMA peaks by volume were Mera Peak (2,633 climbers, 741 teams), Island Peak (2,078 climbers, 739 teams), and Lobuje East (1,775 climbers, 555 teams).
NMA trekking peak fees are significantly lower than DOT 8,000-metre royalties. However, the high volume of permits, particularly for Mera and Island Peak which are commonly added to Everest Base Camp itineraries, generates meaningful aggregate income.
The combined DOT plus NMA total of NPR 1,262.6 million represents a 36.38% jump in a single year. That growth came from both more climbers (up 17.05%) and a higher concentration of activity on higher-royalty peaks.
Casino Revenue from Nepal Tourism 2025
Nepal’s casino sector contributed NPR 450.5 million (NPR 45 crore 5 lakh) in royalty revenue during FY 2024/25. That is a 35.6% increase from NPR 332.1 million (NPR 33 crore 21 lakh) in the previous year.
By the end of FY 2024/25, 36 casinos were operating in Nepal: 10 traditional table-game casinos and 26 modern machine-based operations. The total number grew from 29 casinos in FY 2023/24, with the expansion concentrated entirely in machine-based venues.
Casino access in Nepal is restricted to foreign nationals and non-resident Nepalis, which means casino revenue is a direct function of international tourist arrivals. The expansion of machine-based casinos reflects both regulatory movement and genuine demand, particularly from regional markets like India and China, where casino gaming has a significant following.
The jump from 29 to 36 casinos, alongside the 35.6% royalty growth, suggests the sector is in active expansion. As a tourism revenue stream, casinos are worth watching: they generate concentrated royalties, employ local workers, and extend tourist spending beyond accommodation and trekking.
Protected Area Entry Fees and National Park Revenue
Nepal’s national parks and conservation areas received 514,160 foreign visitors in 2025, a 10.65% increase from 464,653 in 2024.
While the official statistics report does not consolidate a single total for protected area entry fee revenue, the structure of Nepal’s entry fee system means that foreign visitor footfall translates directly into government income.
Standard foreign national entry fees in effect during 2025:
| Protected Area | Entry Fee (Foreign Nationals) |
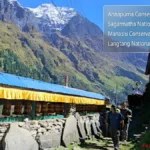
| Annapurna Conservation Area | NPR 3,000 per person |
| Sagarmatha National Park | NPR 3,000 per person |
| Langtang National Park | NPR 3,000 per person |
| Chitwan National Park | NPR 1,500 per person |
| Bardiya National Park | NPR 1,500 per person |
The Annapurna Conservation Area alone received 313,549 foreign visitors in 2025, a 30.56% increase from 240,141 in 2024. At the NPR 3,000 fee, ACAP’s entry revenue would be approximately NPR 940 million from foreign visitors.
Sagarmatha National Park added another NPR 142.5 million at 47,524 visitors. Across all 19 protected areas that received foreign visitors in 2025, total entry fee income would be in the range of NPR 1.5 to 2 billion, though exact totals require confirmation from the national park authority annual reports.
The Restricted Area Permit (RAP) system generates additional revenue from trekkers visiting zones like Manaslu, Upper Mustang, and Tsum Valley. In 2025, 27,531 trekkers visited restricted areas.
Upper Mustang‘s permit fee alone stands at USD 500 for 10 days, making restricted area permits one of the higher-value permit revenue streams in Nepal’s trekking sector.
What Tourism Contributes to Nepal’s Economy
The USD 650.5 million figure measures only what foreign tourists spend directly in Nepal, the foreign exchange earnings captured through the formal economy. The broader economic contribution is larger.
Tourism supports over 500,000 direct jobs across hotels, airlines, trekking agencies, restaurants, transport, and guiding. Indirect employment across supply chains, food production, craft industries, and construction adds considerably more.
Nepal now has:
- 5,099 registered travel agencies (up from 4,963 in 2024)
- 3,332 registered trekking agencies (up from 3,252)
- 5,466 licensed tour guides (up from 5,269)
- 27,962 licensed trekking guides (up from 27,128)
- 222 star-category hotels (up from 214)
- 1,383 non-star tourist hotels
- 64,134 total hotel beds (up from 62,642)
The 16.2% share of total exports that tourism represents is perhaps the clearest economic lens. Nepal’s goods exports are modest relative to import requirements.
Tourism, alongside remittances, is one of the primary mechanisms for bringing foreign currency into the country. A 5.1% increase in tourism earnings is, in practical terms, a meaningful improvement in Nepal’s foreign exchange position.
How Close Is Nepal to Its Pre-Pandemic Revenue Peak?
Nepal earned USD 665.6 million from tourism in FY 2018/19. In FY 2024/25, it earned USD 650.5 million. The gap is USD 15.1 million, or 2.3% short of that record.
At the 5.1% growth rate of FY 2024/25, Nepal would cross the pre-pandemic revenue record in FY 2025/26, assuming similar conditions.
Several indicators support that possibility:
- Arrivals at 1,162,365 in 2025 are still below the 2019 record of 1,197,191, so there is organic arrival growth still available.
- Mountaineering activity is expanding: teams grew 12.84% and royalties grew 36.38% in 2025.
- The 60-and-above age group grew 4.1% in arrivals, and older travelers tend to spend more per day and prefer guided experiences that generate higher tourism revenue.
- And the length-of-stay figure at 16.34 days is, on its own, a genuine positive for total expenditure even if daily rates are lower.
- The complication is that per-visitor daily spending at USD 33.09 remains well below the government’s declared target of USD 125 per tourist per day, a figure set as part of Nepal’s Tourism Decade 2023 to 2032 strategy.
At current spending levels, crossing the USD 665.6 million revenue mark in FY 2025/26 is realistic. But moving sustainably beyond that, toward the revenue scale Nepal’s tourism targets envision, requires meaningful growth in per-visitor spend, not just arrival volume.
The shift toward high-volume, lower-spend regional markets is working against that goal. So is the 6% decline in the trekking and mountaineering visitor segment, which tends to include some of Nepal’s highest-spend travelers.
Final Words
Nepal’s tourism revenue in 2025 tells two stories that are both true at the same time.
The first story is a recovery that is almost complete. At USD 650.5 million, Nepal is within USD 15 million of its pre-pandemic earnings record. Mountaineering royalties grew by more than a third. Casino revenue expanded rapidly. And the average tourist stayed longer in Nepal than at any point in the country’s recorded tourism history.
The second story is that the composition of that revenue is shifting. Daily spending dropped 19%, lower-spend regional markets are growing faster than high-spend Western ones, and the trekking segment, one of Nepal’s most reliable high-value revenue drivers, actually contracted in 2025.
Both stories deserve attention. Because crossing the pre-pandemic revenue threshold is one goal, but sustaining growth beyond it requires something the current data doesn’t yet show: a consistent