Nepal Tourism Data 2025 is out, and the numbers tell a more interesting story than the 1.29% headline growth suggests. Bangladesh is now among Nepal’s top five source countries. Tourists stayed longer than any year on record. Expedition teams grew by nearly 13%. And Lumbini recorded its highest-ever number of international visitors. This report provides a detailed look at Nepal’s tourism performance, visitor trends, trekking and mountaineering statistics, tourism revenue, and industry growth throughout 2025.
What This Nepal Tourism Statistics 2025 Report Covers:
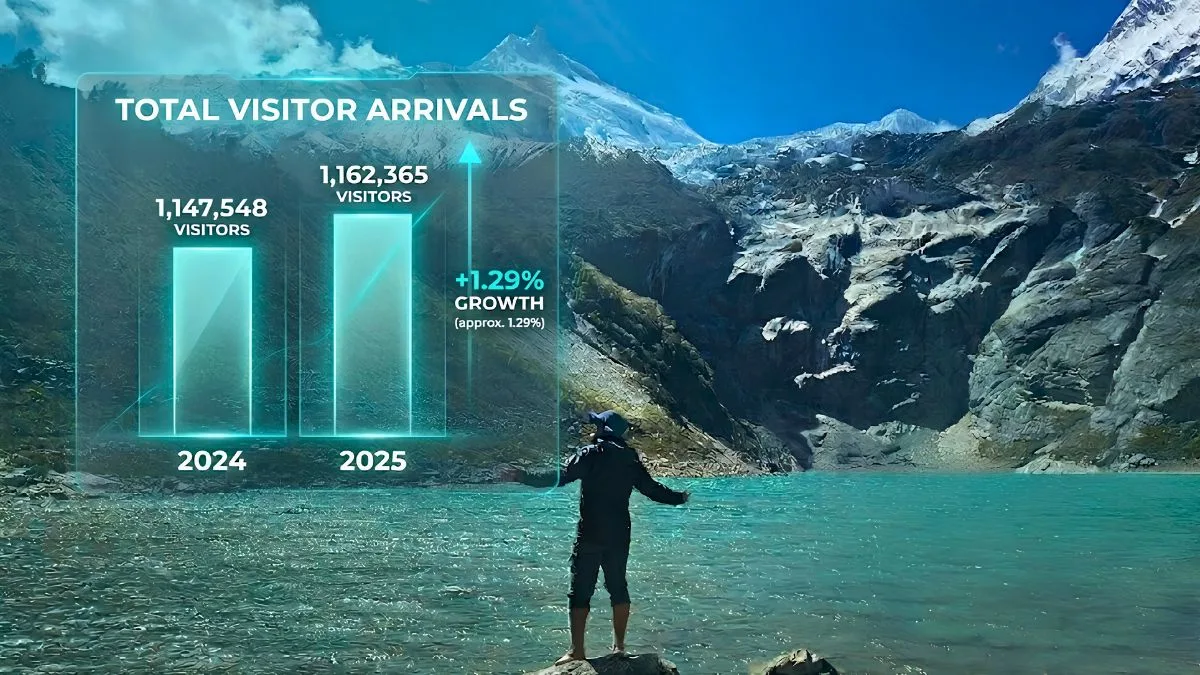
- Total tourist arrivals of 1,162,365 visitors, representing a 1.29% increase compared to 2024
- The top five source countries for Nepal tourism, including Bangladesh’s surprise entry into the rankings
- An average length of stay of 16.34 days, the highest ever recorded in Nepal’s tourism history
- 165,056 trekkers and an analysis of why the Manaslu region attracted the highest number of visitors among restricted trekking areas
- 334 mountaineering expedition teams and a 36.38% increase in government royalty collections from climbing permits
- Lumbini’s record-breaking year with 153,692 international visitors, marking a 37.96% increase from the previous year
- Tourism revenue figures of USD 650.5 million during fiscal year 2024/25 and what they reveal about visitor spending patterns
- Growth in hotel capacity, licensed guides, tourism infrastructure, and the overall tourism industry
- Complete airport traffic, international arrivals, and airline movement statistics for 2025
If you went by the headline number alone, 20co25 would look like a flat year for Nepal tourism. 1,162,365 visitors, a 1.29% increase over 2024 (1,147,548). Nothing explosive, nothing record-breaking.
But the data inside that number is more interesting.
Bangladesh entered Nepal’s top 5 source countries for the first time, pushing Australia out of the ranking. The average length of stay jumped to 16.34 days, the highest figure Nepal has ever recorded, up from 13.3 days in 2024.
Expedition teams grew by nearly 13% and the government earned 36% more in mountaineering royalties. Lumbini had its best year for international visitors. And trekking as a stated purpose of visit dropped 6%, which is a shift worth paying attention to if you follow Nepal’s adventure tourism sector.
I have gone through the full Nepal Tourism Statistics 2025 report, published by the Ministry of Culture, Tourism & Civil Aviation, so you can get everything in one place without reading 122 pages of government data yourself. All figures below come directly from that official source.
Total Tourist Arrivals in 2025
Nepal welcomed 1,162,365 international tourists in 2025. That is an increase of 1.29% compared to 2024, when arrivals stood at 1,147,548.
The growth is modest, but it is growth nonetheless. For context, Nepal is still recovering toward its pre-pandemic peak of 1,197,191 tourists set in 2019. At this pace, that milestone is likely to be crossed in the next year or two.
| Year | Tourist Arrivals | Annual Growth |
|---|---|---|
| 2019 | 1,197,191 | +2.05% |
| 2020 | 230,085 | -80.7% |
| 2022 | 614,869 | +307.3% |
| 2023 | 1,014,882 | +65.05% |
| 2024 | 1,147,548 | +13.07% |
| 2025 | 1,162,365 | +1.29% |
The rapid recovery phase is clearly over. What 2025 shows is stabilization.
Air vs. Land: How Tourists Entered Nepal
The vast majority of tourists still arrive by air. In 2025, 1,015,735 tourists (87.39%) flew into Nepal, with Tribhuvan International Airport being the primary entry point for almost all of them.
Land arrivals, however, showed more significant growth. 146,630 tourists (12.61%) entered by road, which is an 18.6% increase from 123,611 in 2024. Most land arrivals come from neighboring countries, mainly India, with Belahiya (Bhairahawa) being the busiest land entry point.
So while air travel dominates, the land border numbers are worth watching, especially as regional connectivity and India-Nepal road travel continues to grow.
Where Nepal’s Tourists Come From
India remains the largest source of tourists by a significant margin, accounting for over one in four visitors. The United States holds a consistent second place. And here is what changed in 2025: Bangladesh broke into the top five for the first time in recent years, replacing Australia.
| Rank | Country | Share of Total Arrivals |
|---|---|---|
| 1 | India | 25.24% |
| 2 | USA | 9.70% |
| 3 | China | 8.24% |
| 4 | UK | 5.07% |
| 5 | Bangladesh | 4.98% |
India’s dominance is largely explained by geographical proximity and strong cultural ties.
The US and UK presence reflects Nepal’s sustained appeal to long-haul adventure and cultural travelers.
Bangladesh’s entry into the top five countries visiting Nepal is worth paying attention to, likely driven by the growing middle class in the region and relatively easy connectivity.
When Do Most Tourists Visit Nepal?
Nepal has two clear peak seasons. Autumn (October and November) and spring (March, April, and May) consistently see the highest arrivals.
The report’s monthly arrival data from 1995 to 2025 confirms this pattern holds year after year. October is typically the single busiest month, followed by November and March. The monsoon months of July and August see the lowest footfall from international visitors.
If you are planning a trip and want to avoid peak crowds, late February or early December are reasonable windows where weather is still manageable but tourist numbers are lower. January sees noticeably fewer visitors, though this comes with cold temperatures, particularly at altitude.
[INTERNAL LINK: Best time to visit Nepal, month-by-month guide]
Who Visits Nepal: Age and Gender Breakdown
By gender, the split in 2025 was:
- Male: 635,505 (54.7%)
- Female: 526,441 (45.3%)
- Others: 419
Female arrivals grew faster (+2.4%) than male (+0.4%), continuing a gradual trend toward a more balanced gender split that has been visible over the past several years.
By age, the 31 to 45 age group makes up the largest segment of Nepal’s tourists:
| Age Group | 2025 Arrivals | Year-on-Year Change |
|---|---|---|
| 0–15 | 63,415 | -2.2% |
| 16–30 | 218,515 | +2.3% |
| 31–45 | 356,049 | +1.1% |
| 46–60 | 308,327 | -0.4% |
| 60+ | 211,194 | +4.1% |
The 60 and above age group recorded the strongest growth at +4.1%. This fits a broader pattern you see globally. Older travelers, many of them post-retirement, are traveling more and choosing destinations like Nepal for cultural and spiritual experiences.
Why Tourists Visit Nepal
Holidays and leisure remain the dominant reason, but the purpose-of-visit data shows a gradual diversification away from straightforward vacation travel.
| Purpose | 2025 Tourists | Share | Change vs. 2024 |
|---|---|---|---|
| Holiday / Leisure | 699,744 | 60.2% | +1.0% |
| Pilgrimage | 167,380 | 14.4% | +0.6% |
| Trekking & Mountaineering | 165,056 | 14.2% | -6.0% |
| Others (business, VFR, medical) | 130,185 | 11.2% | +15.8% |
Two things stand out here. The “Others” category grew by 15.8%, which reflects Nepal’s expansion as a destination beyond just tourism. Business travel, visiting friends and relatives, and medical travel are all rising. And trekking and mountaineering dropped 6%, which is a notable shift given how central adventure travel is to Nepal’s identity internationally.
Trekking and Expedition Numbers
165,056 tourists listed trekking and mountaineering as their primary purpose of visit in 2025. Among restricted trekking areas, 27,531 trekkers visited routes requiring special permits.
The breakdown by major restricted area:
| Trekking Area | 2025 Trekkers | Change vs. 2024 |
|---|---|---|
| Manaslu (Gorkha) | 14,720 | +14.91% |
| Upper Mustang | 4,178 | -25.58% |
| Gorkha Tsum Valley | 2,513 | -2.10% |
| Kanchanjunga | 1,680 | -11.67% |
| Lower Dolpa | 1,092 | -18.99% |
| Humla | 770 | -26.32% |
| Upper Dolpa | 281 | -57.23% |
Manaslu is the clear standout, with nearly a 15% increase. Several other restricted areas saw significant drops, particularly Upper Dolpa (-57.23%) and Humla (-26.32%). Whether that is permit-related, infrastructure, or shifting trekker preferences is something the data alone does not fully explain.
On the mountaineering side, 2025 was a strong year:
- 334 expedition teams permitted (up 12.84% from 296 in 2024)
- 2,766 total climbers (up 17.05%)
- Government royalty: NPR 12,62,635 thousand, up 36.38% from 2024
The most climbed peaks under the Nepal Mountaineering Association (NMA) were Mera Peak (2,633 climbers), Island Peak / Imja Tse (2,078 climbers), and Lobuje East (1,775 climbers).
Pilgrimage Tourism: Lumbini and Pashupatinath
Nepal’s two most significant pilgrimage sites tell different stories in 2025.
Lumbini, the birthplace of Gautama Buddha and a UNESCO World Heritage Site, saw a major surge in international visitors. A total of 1,126,419 people visited Lumbini in 2025, including:
- 702,910 Nepali visitors
- 269,817 Indian visitors
- 153,692 third-country visitors (up 37.96% from 111,403 in 2024)
Among international visitors from outside India, Sri Lanka sent the most (32,287), followed by Thailand (19,891) and Myanmar (18,528). The strong Buddhist-majority country representation tracks with what you would expect for a site of this religious significance.
Pashupatinath Temple received 122,431 international visitors in 2025, a 10.07% decrease from 136,139 in 2024. October remained the peak month (23,739 visitors), with March and April also seeing high footfall.
The decline at Pashupatinath while Lumbini surged is an interesting contrast. Religious tourism in Nepal is not a single, uniform story. The patterns at different sites can and do diverge quite significantly.
National Parks and Conservation Area Visitors
Foreign visitor numbers to Nepal’s national parks and conservation areas reached 514,160 in 2025, up 10.65% from 464,653 in 2024.
National parks are among the more consistent growth areas in Nepal’s tourism data, with visitor numbers rising steadily. Wildlife tourism, particularly at Chitwan and Bardia, draws a different segment of travelers compared to the mountain-focused majority, and that segment is growing.
[INTERNAL LINK: Nepal national parks, entry fees, permits and what to expect]
How Much Nepal Earns from Tourism
In fiscal year 2024/25, Nepal earned NPR 88,660.8 million from tourism, equivalent to approximately USD 650.5 million. That is a 5.1% increase over the previous year in USD terms.
Tourism’s contribution to Nepal’s GDP stood at 1.5% in 2024/25, with the sector accounting for 16.2% of total merchandise and service exports.
For context, Nepal’s tourism earnings peaked at USD 665.6 million in FY 2018/19, just before the pandemic. The 2024/25 figure is getting close to that peak, though the exchange rate movements over that period mean the NPR values tell a somewhat different story.
One number that moved in the opposite direction: the average spend per visitor per day dropped from USD 40.8 in 2024 to USD 33.09 in 2025, an 18.91% decline. This happens alongside longer stays, which suggests more budget-conscious travelers, a shift in traveler mix, or possibly that the new electronic Tourism Management Information System (CETMIS) is capturing spending data differently than the older estimation method.
Average Length of Stay
Tourists stayed an average of 16.34 days in Nepal in 2025, a 22.9% increase from 13.3 days in 2024.
This is worth noting separately. 2025 is the first year this figure is drawn from CETMIS, the new centralized electronic tracking system, rather than estimated from historical patterns. So the jump may partly reflect a more accurate measurement methodology rather than purely behavioral change. The report acknowledges this distinction.
Regardless, longer stays mean more spending on accommodation, food, transport, and activities. That is a positive signal for the economy, even if the per-day spend figure is lower.
Hotels, Agencies, and Industry Size
Nepal’s hospitality and tourism infrastructure continued to grow in 2025:
| Indicator | 2024 | 2025 | Change |
|---|---|---|---|
| Star hotels | 214 | 222 | +3.74% |
| Non-star tourist hotels | 1,364 | 1,383 | +1.39% |
| Total hotel beds | 62,642 | 64,134 | +2.38% |
| Travel agencies | 4,963 | 5,099 | +2.74% |
| Trekking agencies | 3,252 | 3,332 | +2.46% |
| Licensed tour guides | 5,269 | 5,466 | +3.74% |
| Licensed trekking guides | 27,128 | 27,962 | +3.07% |
The growth is incremental but consistent across every category. Nepal now has over 64,000 hotel beds, more than 5,000 travel agencies, and close to 28,000 registered trekking guides serving the industry.
International Flights and Airport Movement
Tribhuvan International Airport (TIA) handled 34,600 international flights in 2025 (17,300 arrivals, 17,300 departures), a 4.07% increase from 33,247 in 2024.
Total international passenger movement through TIA reached 5,045,077, up from 4,963,466 in 2024.
The top airlines by passenger movement in 2025:
| Airline | Total Passengers |
|---|---|
| Nepal Airlines (NAC) | 606,333 |
| Air India (AIC) | 499,743 |
| Himalaya Airlines (HIM) | 474,987 |
| Qatar Airways (QTR) | 446,825 |
| IndiGo (IGO) | 434,057 |
Nepal Airlines reclaimed the top spot in 2025, switching places with Qatar Airways which led in 2024. Himalaya Airlines has established itself as a consistent third.
Gautam Buddha International Airport (Bhairahawa) also recorded international operations in 2025, handling 247 flights and 14,697 passengers. Still marginal, but an indication that Bhairahawa’s runway is being used for international routes.
Final Words
A few things stand out when you look at the data as a whole.
Growth has normalized. The explosive post-pandemic recovery is done. Nepal is now in a phase where 1% to 5% annual growth in arrivals is probably the realistic baseline unless there is a major new push on connectivity or destination marketing.
Spending per day dropped while stays got longer. This suggests a shift in traveler profile. Longer-stay, lower-daily-spend visitors, possibly more backpackers or budget trekkers in the mix, or travelers choosing longer itineraries that stretch the same budget over more days.
Pilgrimage tourism is growing fast. Lumbini’s 38% jump in third-country visitors and the steady performance of religious tourism as a category suggests this is an underappreciated growth segment.
And the 60+ age group growing at 4.1% is a demographic shift worth watching. Older travelers tend to spend more, prefer guided experiences, and are less deterred by cost. If Nepal can develop better infrastructure for that segment, there is a real opportunity!